Time for Week number 2. Still on my wife’s computer so my productivity has taken a hit. It’s almost like the universe has it in for basic logic.

Again, draw you own conclusions(Image courtesy of xkcd.com)
The universe apparently doesn’t want you to have my rankings in a timely manner, complain to your local deity.
You know the drill. Read the Basics if you’re new. To properly rank Teams we need data but we don’t have a large enough sample size to do this as of yet so. So first we need the data from the Automated Wins Produced site for 2010-2011 so far (is powered by NerdNumbers)
I used stats for the NBA as of 11/09/2010. So the first part of the rankings is based on how everyone played so far, the second is based on my final preseason projection. Why should my preseason predictions hold any weight?Let’s talk Picks.
The Picks:
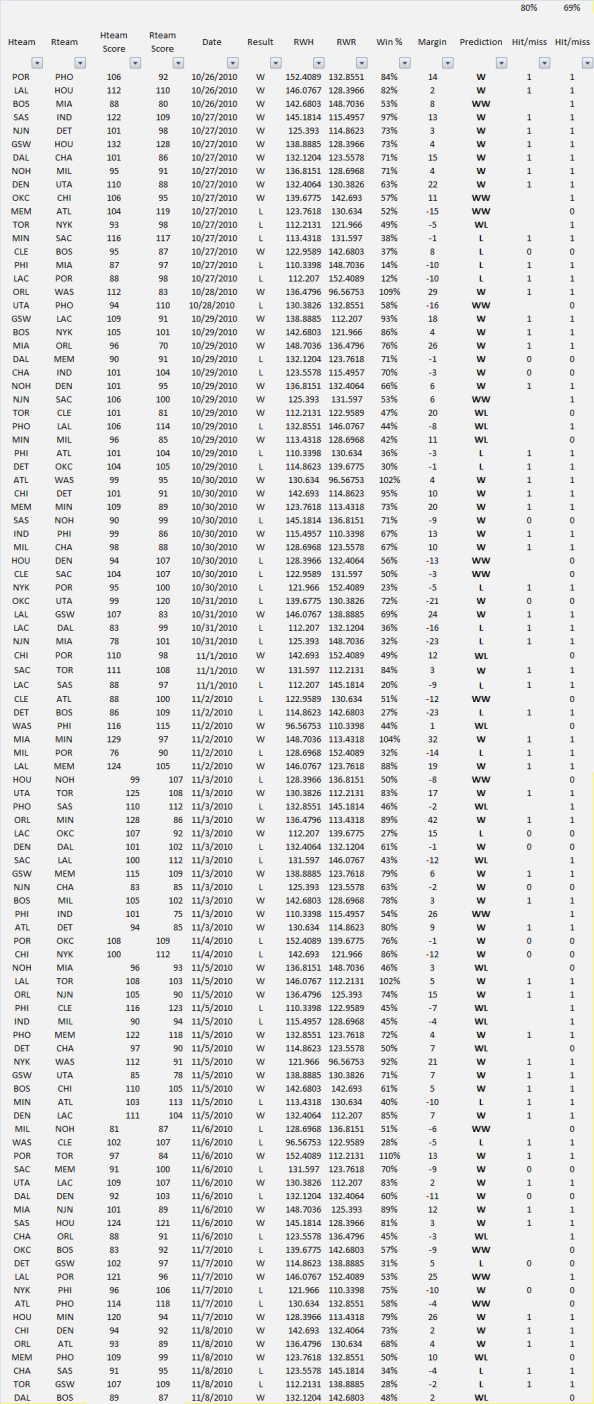
Take a look:
To explain, I took the raw wins predictions for each team combined it with the equation for home team winning I came up with for a single game (see here for detail). To put it simply:
Probability of Home team winning a game = (Projected Wins Home Team-Projected Wins Road Team)/82 +.606
Then I worked it out for every game so far as follows:
- If W% is greater than 60% call it a strong Win
for the home team
- If W% is greater than 50% but less than 60% call it a weak Win (WW) for the home team
- If W% is greater than 40% but less than 50% call it a weak Loss (WL) for the home team
- If W% is less than 40% call it a strong Loss (L) for the home team
I then did the math for all the models from the Wages of Wins Network 2011 NBA Super Stat Geek Smackdown and commenters across the web (see below).
I ranked them based on accuracy and also ranked them using a points system based on user comment as follows:
- Assign a point per game called correctly
- Assign an additional point for a strong call
- Penalize 1 point for a miss.

Enough fun nerdplay. Let’s get to the Rankings.
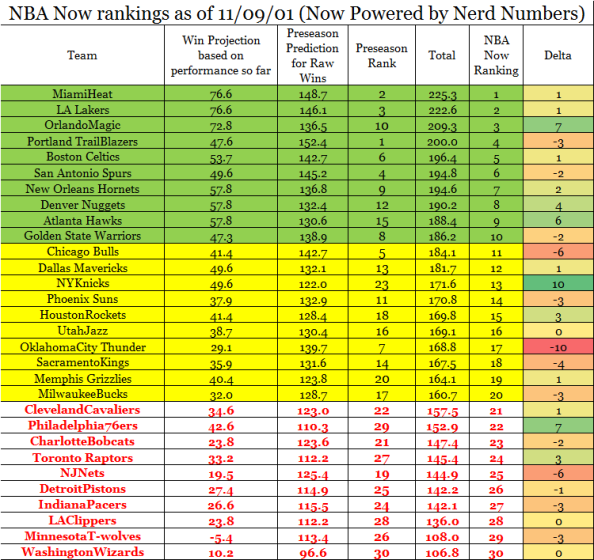
NBA Now Rankings Week #2
And order is somewhat restored to the world with the Heat, Lakers and Magic 1,2,3. Blazers fall to 4 . Celtics, Hornets, Hawks and Nuggets move up and Spurs and Warriors move down to round out the top 10.
11-20 see the Knicks making a huge move to 13 with Rookie of the Year so far Landry Fields and the Thunder dropping ten to 17 on the back of lousy play at the 4/5 by anyone other than Serge Ibaka.
As for the bottom 10, the 76ers are frisky (or have they played a weak sched? we’ll see). The Nets so far are worse than what we thought (save us from the Murphy posts please) and the T-wolves are in the hunt for the most ping pong balls.

Kahn is bringing it (and hopefully not leaving whatever "it" is)

The Method for Evaluation
To evaluate how the predictions are doing, I take everyone’s raw wins predictions for each team and combine it with the equation for home team winning I came up with for a single game (see here for detail). To put it simply:
Probability of Home team winning a game (Win %)
= (Projected Wins Home Team-Projected Wins Road Team)/82 +.606
=Win %: (Proj. Home Team Win% – Proj. Road Team Win%) +HCA(.606)
Then I worked it out for every game so far as follows:
- If W% is greater than 60% call it a strong Win
for the home team
- If W% is greater than 50% but less than 60% call it a weak Win (WW) for the home team
- If W% is greater than 40% but less than 50% call it a weak Loss (WL) for the home team
- If W% is less than 40% call it a strong Loss (L) for the home team
- I then look at everyone’s hit rate for strong predictions and for all predictions.
- I rank each model/analyst for both
- I assign points based on ranking (double points for strong predictions since I value those more)
Hit Ratio (Strong): % of all games were the win % is >60% or less than 40% picked correctly (on average about 33 games per model)
But I’m intrigued by Guy’s Request. If I:
- Assign a point per game called correctly
- Assign an additional point for a strong call
- Penalize 1 point for a miss.


robbieomalley
11/10/2010
Just gimme time.
arturogalletti
11/10/2010
That’s the one thing they’re not making more of you know 🙂
Guy
11/10/2010
It might be interesting to include point differential to these posts, or even better something like BBR’s SRS (opponent-adjusted point differential). Early in the season, SRS is a much better measure of performance than actual W and L. It will give you a much better read on which predictions are likely to emerge as strongest in the end. For example, Portland is playing much worse than its record indicates, while Denver is the reverse. As the season progresses the two methods will converge and tell the same story, but early on you’re better off looking at SRS.
some dude
11/10/2010
Not sure that Denver comment holds after tonight! 😛
arturogalletti
11/11/2010
Guy,
I’m looking at historical data as a side project to see what the best indicator is. Definitely a future topic.
Guy
11/11/2010
Hard to imagine there’s a better measure of performance than point differential, adjusted for strength of opponent (in terms of predicting final record). I would guess that’s a better measure than actual record for at least the first half of the season; after that, they will probably tell you the same thing so it won’t matter. But surprise us!
some dude
11/10/2010
1. Does this include tonight’s games?
2. Do you factor in actual record already attained and then model the rest of the games or do you model the entire season solely based on the WP48 numbers. I think the model should take the current win total and project the rest of the season to find the wins projected rather than just tell what we already will know after game 82.
3. T-wolves projected at negative wins when they already won a game…
I’ve recently thought of a problem with your model. It doesn’t adjust for garbage time minutes. a player who produces -.2 wins for the season but plays 95% of his minutes when the outcome of the game is already determined doesn’t actually produce anything negative (same for positive garbage time players too, of course).
Also wish we could see variability of production too (heat seem to be obliterating lesser teams but struggling against 3 of 4 good ones).
arturogalletti
11/11/2010
Sd,
1. No
2. Keep in mind work in progress. The full season will let us know what’s best.
3. Rambis is a bit mental. Plus small sample sizes (and stuff just happens)
Variability is something that would be nice but we need to build some tools for it.
Marc Brazzill
11/10/2010
No predictions for this week?
arturogalletti
11/11/2010
OK, a little late but there.
Fred Bush
11/10/2010
Rockets start 1-5, move up 3 spots in predicted rankings?
some dude
11/10/2010
Rockets have pretty much lost to better teams. They are 1-5 but have played well statistically. Now that the schedule is turning the corner, there will be little to complain about should they win 4 in a row (Wash, Indy, NYK following the recent Minn win).
some dude
11/10/2010
Of course after i say this Yao gets hurt to go along with Bbrooks and they lose to the Wiz.
Sorry Rocket fans. My bad.
reservoirgod
11/11/2010
John Wall is going to single-handedly ruin my Wizards prediction… I didn’t see a lot of him in college until the tournament. If I knew he was this exciting to watch I would’ve picked them to win more games just because I don’t want to root against him. He’s incredible…
arturogalletti
11/11/2010
RG,
76ers and Rockets JV are not a representative sample. That said, the kid is better than I thought (there’s an opportunity in the rookie projections).
reservoirgod
11/14/2010
Yeah, but I think Wall is going to produce more than 6 wins all by himself. Unless Wall hits the wall in January. Which I don’t wanna root for – he gives me more value for my league pass subscription when he’s playing well.